
If Sampling Plans Could Talk: A Validation Perspective on Pass / Fail Statistics
Every attribute sampling plan answers two questions: how many units do you check, and how many defects can you find before you call the run unacceptable? We call those the check size and the pass limit, and getting them right means weighing two risks: OP risk, the risk of rejecting a run that was actually fine, and QR risk, the risk of accepting one that wasn't.
Meet three plans built for three different situations.
Casual Aiyana's plan covers a cosmetic characteristic on a legacy process: a check size of 32, a pass limit of two defects, a manufacturing defect rate around 2.5%, and a cutoff defect rate near 16%. That's a wide gap between the two, and for a minor cosmetic issue with a long operating history, that gap is a reasonable trade.
Solid Elena's plan covers an effectiveness characteristic on an enhanced process. She keeps the same pass limit of two defects but raises the check size to 125. Her manufacturing defect rate drops under 1%, and her cutoff sits around 4%, a tighter gap appropriate for something that affects how the product performs. That's check size doing its job on its own: raising it moves OP risk and QR risk lower together and narrows the gap between them.
Flawless Rafael's plan covers a safety characteristic on a new process: 125 units, zero tolerance for defects. His manufacturing defect rate barely registers, a few hundredths of a percent, and his cutoff holds under 2%. Zero tolerance doesn't just narrow the gap between OP risk and QR risk, it changes the shape of the curve itself, producing a sharp drop instead of a gentle bend. That same rigor, applied to a process with an appreciable real-world defect rate, produces alarms that are more about the plan than about the process.
Check size and pass limit do two different jobs. Check size moves OP risk and QR risk together and narrows the gap between them. Pass limit is what actually reshapes the curve, trading one risk against the other. Aiyana, Elena, and Rafael each land in a different place because their processes call for a different shape, not because one plan is more careful than another.
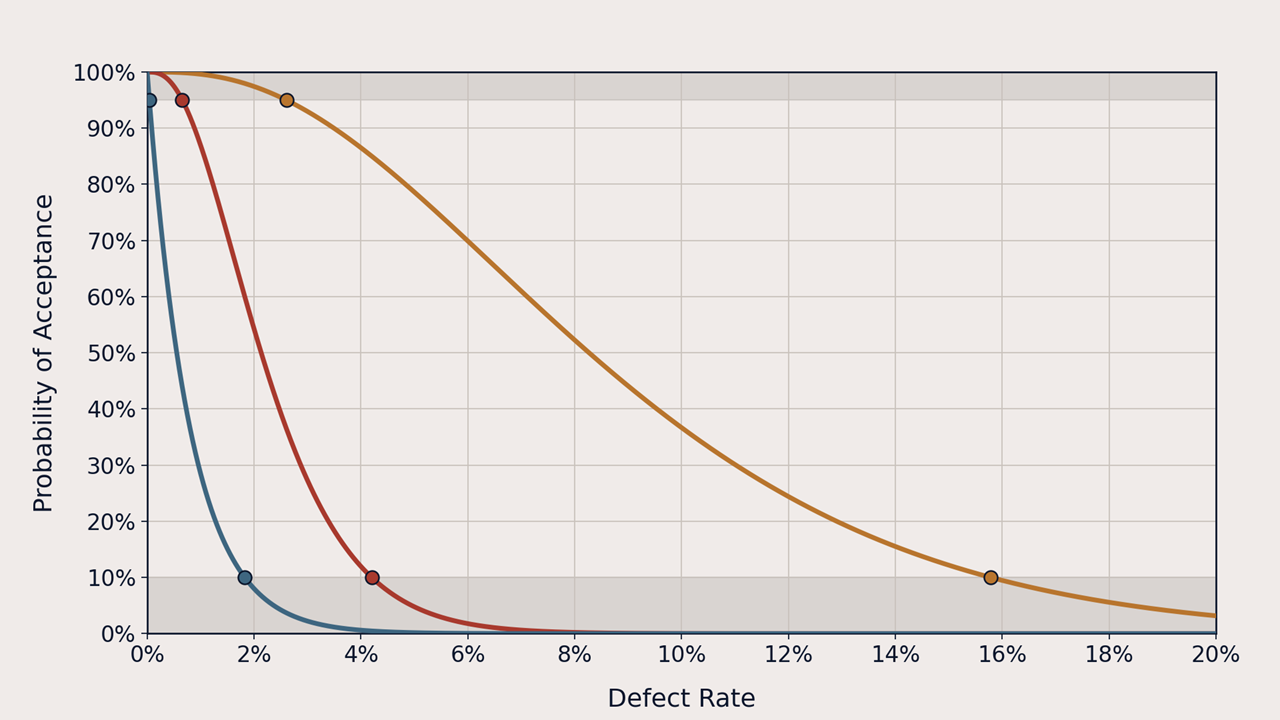
OC Curve for three sampling plans
Nerd Alert: if you're comfortable with check size, pass limit, OP risk, and QR risk, you already have what you need, and the next section isn't for you. If you've been mentally translating this into AQL, acceptance number, and producer's risk the whole time, or you're folding this into training that runs on the standard vocabulary, keep reading.
As a certified Six Sigma Black Belt and trainer, I built this video's language on top of the same framework behind ANSI/ASQ Z1.4 and ISO 2859-1, the standards most attribute sampling plans are built from. Here's how the two line up.
Check size is the sample size (n): the number of units drawn from the lot (called a "run" in the video, to sidestep the sales connotation of "lot") for inspection. Pass limit is the acceptance number (Ac, or c): the maximum number of nonconforming units the lot can carry before it's rejected. Rafael's plan, with zero tolerance, is a c=0 plan in that vocabulary.
The cosmetic, effectiveness, and safety characteristics in the video correspond to the standard's minor, major, and critical defect classifications: minor affects appearance only, major affects whether the product performs its intended function, and critical could create a hazardous or unsafe condition.
OP risk is producer's risk (α), evaluated at the AQL, the Acceptable Quality Level (also written Acceptable Quality Limit). QR risk is consumer's risk (β), evaluated at the RQL or LTPD, the Rejectable Quality Level or Lot Tolerance Percent Defective. The manufacturing defect rate in the video is the defect rate at the AQL point; the cutoff defect rate is the defect rate at the RQL/LTPD point. Plotted together, probability of acceptance against true defect rate, they trace the operating characteristic (OC) curve: an S-shaped curve that flattens toward a near-vertical drop as the acceptance number approaches zero, exactly what Rafael's c=0 plan produces.
For a Six Sigma audience used to thinking in defects per million opportunities rather than percentages: Rafael's manufacturing defect rate of roughly 0.05% converts to about 500 DPMO. The sigma level that corresponds to a given DPMO depends on assumptions about how centered the process is, so treat any sigma-level equivalence as an approximation, not an exact figure.
Want to see how these numbers move for a plan of your own? The interactive calculator below runs on the same math behind Aiyana's, Elena's, and Rafael's plans: enter a sample size and acceptance number and watch the OC curve, and the OP risk and QR risk points on it, shift. If you'd rather work with it offline or drop it into your own validation documentation, use the request for below to receive the full spreadsheet.
If Sampling Plans Could Talk: Try the Numbers Yourself

Enter a check size and pass limit to see how Aiyana's, Elena's, and Rafael's plans (or your own) shift the Operations / Projects (OP) risk and Quality / Regulatory (QR) risk points on the curve.
From the video "If Sampling Plans Could Talk: A Validation Perspective on Pass / Fail Statistics".
| Video term | Formal term |
|---|---|
| Check size | Sample size (n) |
| Pass limit | Acceptance number (Ac or c) |
| OP risk | Producer's risk (α), evaluated at the AQL |
| QR risk | Consumer's risk (β), evaluated at the RQL / LTPD |
| Manufacturing defect rate | Defect rate at the AQL point |
| Cutoff defect rate | Defect rate at the RQL / LTPD point |
For educational use only. This calculator illustrates the relationship between sample size, acceptance number, and acceptance sampling risk; it does not replace a validated sampling plan developed for your specific process and quality system.
Brayearst Validation Consulting · www.brayearst.com
Want to run these numbers offline?
Receive the full calculation engine spreadsheet: the same math behind the calculator above, with editable inputs and a glossary tab, ready to drop into your own validation documentation.
